

Climate change will not impact every city, town, and county in the same way, nor to the same extent. Explore the Hoosier Resilience Index, created by the Environmental Resilience Institute, to learn about your area's current and projected climate impacts, evaluate your community's sensitivity, and prioritize actions to prepare.
Evaluate your risks and learn how to prepare
Use the map and charts below to explore statewide and county-by-county extreme heat, extreme precipitation, and floodplain land use data. To see this information along with data on social vulnerability for your individual town, city, or county, enter your community name into the community selection box further down the page
The average number of days per year between 1971 and 2000 with highs 90°F or greater and nights with lows 68°F or greater.
The projected average number of days per year between 2041 and 2070 with highs 90°F or greater and nights with lows 68°F or greater, based on a scenario that assumes countries around the globe will simultaneously and effectively reduce greenhouse gas emissions.
The projected average number of days per year between 2041 and 2070 with highs 90°F or greater and nights with lows 68°F or greater, based on a scenario that assumes countries around the globe do not try to achieve greenhouse gas reductions.
The average number of days per decade between 1971 and 2000 with precipitation amounts two inches or greater.
The projected average number of days per decade between 2041 and 2070 with precipitation amounts of two inches or greater, based on a scenario that assumes countries around the globe will simultaneously and effectively reduce greenhouse gas emissions.
The projected average number of days per decade between 2041 and 2070 with precipitation amounts of two inches or greater, based on a scenario that assumes countries around the globe do not try to achieve greenhouse gas reductions.
Land within the 100-year and 500-year floodplains, as of 2020, that was primarily devoted to human activity, such as living and working.
Extreme Heat Events
The average number of days per year with highs 90°F or greater and nights with lows 68°F or greater. Note – this map layer cannot be turned on at the same time as Land Use.
Extreme Precipitation Events
The average number of days per decade when daily precipitation is two inches or greater. Note – This map layer can be turned on with Extreme Heat or Land Use, but not both.
Land Use
Land use as of 2020. Note – this map layer cannot be turned on at the same time as Extreme Heat.
| Timeframe | No. of Extreme Heat Events per Year
The average number of days per year with highs 90°F or greater and nights with lows 68°F or greater. |
No. of Extreme Precipitation Events per Decade
The average number of days per decade when daily precipitation is two inches or greater. |
|---|---|---|
|
Current
The calculated average between 1971 and 2000. |
- | - |
| 2050s - Medium Emissions Scenario
The projected average between 2041 and 2070, based on a scenario that assumes countries around the globe will simultaneously and effectively reduce greenhouse gas emissions. |
- | - |
| 2050s - High Emissions Scenario
The projected average between 2041 and 2070, based on a scenario that assumes countries around the globe do not try to achieve greenhouse gas reductions. |
- | - |
| Land Use Type
Land use as of 2020. Note – this map layer cannot be turned on at the same time as Extreme Heat. |
Acres in the Floodplain
The percent of acres in the 100-year and 500-year floodplains, as of 2020. 100-year flood: A flood event that statistically has a 1% (1 in 100) chance of occurring in a given year. 500-year flood: A flood event that statistically has a 0.02% (1 in 500) chance of occurring in a given year. |
Percent of Total Acres in the Floodplain
The percent of acres in the 100-year and 500-year floodplains, as of 2020. 100-year flood: A flood event that statistically has a 1% (1 in 100) chance of occurring in a given year. 500-year flood: A flood event that statistically has a 0.02% (1 in 500) chance of occurring in a given year. |
|---|---|---|
| Agriculture
Land primarily devoted to growing crops, and raising and harvesting animals. |
- | - % |
| Developed
Land primarily devoted to human activity, such as living and working. |
- | - % |
| Forest and Vegetation
Land used primarily to preserve nature, which is generally inaccessible to the public. |
- | - % |
| Wetland
Land with permanently or seasonally waterlogged soil, such that conditions are suitable for water-loving vegetation. |
- | - % |
| Total Acres in the Floodplain | - | 100% |
What can I learn from this map?
This page provides an overview of the data provided through the Hoosier Resilience Index. To see more detailed information for an individual town, city, or county, enter the community name into the community selection box further down the page.
The data displayed above and throughout the Hoosier Resilience Index are based on observational weather data and on climate projection data from the Indiana Climate Change Impacts Assessment. The 2050s data are based on climate projections for medium and high greenhouse gas emission scenarios.
The medium emissions scenario assumes that countries around the globe will simultaneously and effectively reduce greenhouse gas emissions.
The high emissions scenario assumes that countries around the globe do not try to achieve greenhouse gas reductions, resulting in a high level of greenhouse gas emissions.
The information in the maps and charts demonstrate that all counties in the state are expected to experience more extreme heat and precipitation events.
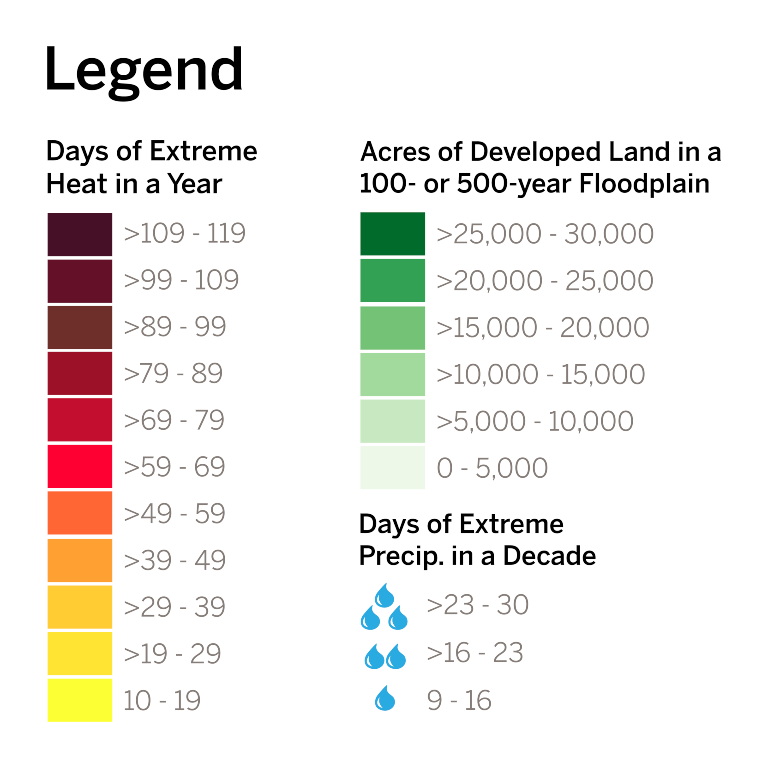
Toggle between the current and 2050s data projections to see that counties in the south and the southeast are expected to experience the greatest increase in the number of extreme heat events, as indicated by the dark red colors. All counties are expected to experience more days above 90°F and nights above 68°F than they are experiencing now. Note that counties in the central and northern parts of the state are likely to experience significant temperature increases, as well.
Toggle between the current and 2050s data projections to see a visual representation of the frequency of extreme precipitation events for each county. All counties are expected to experience more precipitation events at or above 2 inches. Counties in the southeast part of Indiana will likely see the greatest number of extreme precipitation events, as indicated by a county displaying more rain drops.
Turn on the land use layer, which cannot be viewed at the same time as the extreme heat layers, to see the distribution of developed land across the state. Dark green counties have a higher number of developed acres in the floodplain compared to the rest of the state. Not surprisingly, the areas with the largest amount of developed land in the floodplain are in the state’s largest cities. With the land use layer turned on, toggle between the precipitation layers to consider how land use could be impacted by increasing amounts of precipitation.
Please Note
**These data display the number of days of extreme heat and extreme precipitation events; the data do not convey how hot the days will get or how large the storms will be. The numbers do not include an assessment of seasonal variation or the ration of snow to rain, both of which are expected to change under future climate scenarios. Furthermore, it is possible that the number of projected precipitation events is lower than what a community is currently experiencing per decade, on average. In such a case, this would not indicate that a community will receive less total rain, because it is possible that a community will experience fewer extreme precipitation events, but with the precipitation amounts being larger.
**The projections for temperature and precipitation, on average across the state, are expected to continue to increase past the 2050s. Refer to the Indiana Climate Change Impacts Assessment to see 2080 projections.
Readiness Assessment and Scores
The Hoosier Resilience Index provides a Readiness Assessment to help local governments evaluate their community's preparedness for climate risks, and identify and prioritize next step actions to increase community readiness. Upon completion of the assessment, the Environmental Resilience Institute will provide three readiness scores: Extreme Heat, Extreme Precipitation, and Floodplain Land Use.