

Technical Manual:
The Indiana Climate Change Impacts Assessment identifies rising average annual temperatures and rising average annual precipitation as the most significant climate change impacts in the state. To understand how these impacts will affect communities in Indiana, the Hoosier Resilience Index provides data on four key vulnerability indicators for every county and incorporated city and town in Indiana: extreme heat, extreme precipitation, floodplain land use, and social vulnerability.The sections below provide the methodologies and sources used for each indicator.
Extreme Heat
The average number of days per year with extreme heat is calculated for each Indiana county, for two time periods: current (1971-2000), and the 2050s (2041-2070) under two scenarios, resulting in three extreme heat event totals overall. The current data are based on observational weather data, and the data for the 2050s are based on climate projection data for “medium” and “high” greenhouse gas emission scenarios, also referred to as the Representative Concentration Pathways 4.5 and 8.5 scenarios (RCP4.5 and RCP8.5, respectively; Van Vuuren, et al., 2011).
RCP4.5 assumes that countries around the globe will simultaneously and effectively reduce greenhouse gas emissions (Thomson et al., 2011).
RCP8.5 assumes that countries around the globe do not try to achieve greenhouse gas reductions, resulting in a high level of greenhouse gas emissions (Riahi et al., 2011).
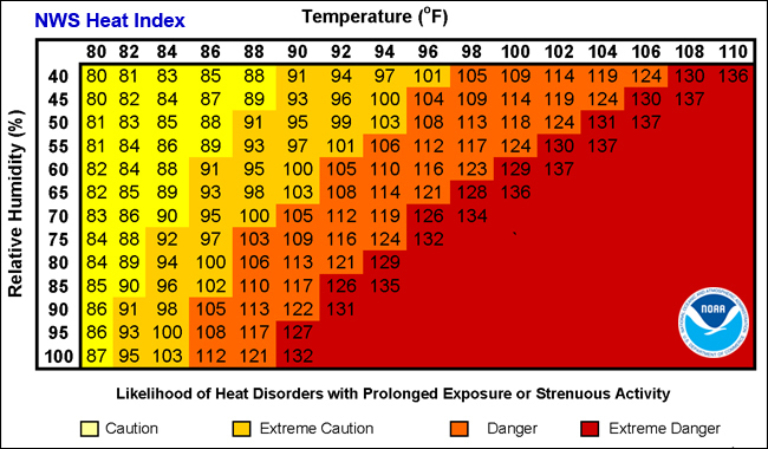
The Hoosier Resilience Index defines extreme heat events as days with highs 90°F or greater and nights with lows 68°F or greater. Increasing daytime and nighttime temperatures are hazardous to human health, especially for sensitive populations (e.g. children, the elderly, low-income households, outdoor workers; Filippelli, et al., 2018).
The Extreme Heat data provided only account for the frequency of extreme temperatures and do not explicitly include humidity. Nighttime low temperatures, however, provide a close approximation of the dewpoint temperature (and, therefore, humidity). Increased humidity exacerbates the health implications of extreme heat, as illustrated in the National Weather Service’s Heat Index (See Figure 1).
The total number of extreme heat events is the sum of High Heat Days, High Heat Nights, and High Heat Days with High Heat Nights.
High Heat Days (HD):
Number of days, on average per year, where daily high temperature (T) is 90°F or greater and daily low temperature is less than 68°F.
Tmax ≥ 90°F AND Tmin < 68°F
High Heat Nights (HN):
Number of days, on average per year, where daily high temperature (T) is less than 90°F and daily low temperature is 68°F or greater.
Tmax < 90°F AND Tmin ≥ 68°F
High Heat Days with High Heat Nights (HDHN):
Number of days, on average per year, where the daily high temperature (T) is 90°F or greater and daily low temperature is 68°F or greater.
Tmax ≥ 90°F AND Tmin ≥ 68°F
Three Extreme Heat data points are calculated per county in Indiana.
Current Extreme Heat:
The 30-year (1971-2000, i.e. current period) average number of observed days with temperature highs 90°F or greater (i.e. High Heat Days), the 30-year average number of observed days with temperature lows 68°F or greater (i.e. High Heat Nights), and the 30-year average number of observed days with temperature highs 90°F or greater and lows 68°F or greater (i.e. High Heat Days with High Heat Nights).
2050s Extreme Heat, Medium Emissions Scenario:
The 30-year (2041-2070, i.e. 2050s period) average projected number of days identified as High Heat Days, High Heat Nights, and High Heat Days with High Heat Nights, as calculated with the Representative Concentration Pathway 4.5.
2050s Extreme Heat, High Emissions Scenario:
The 30-year (2041-2070, i.e. 2050s period) average projected number of days identified as High Heat Days, High Heat Nights, and High Heat Days with High Heat Nights, as calculated with the Representative Concentration Pathway 8.5.
Data Sources
The input observation data used to generate the current Extreme Heat data were provided by Alan Hamlet (University of Notre Dame) and the Purdue Climate Change Research Center, which coordinated the Indiana Climate Change Impacts Assessment (Hamlet et al., 2018; Byun and Hamlet, 2018).
The input projected data used to generate both 2050s Extreme Heat scenario data were also provided by Alan Hamlet (University of Notre Dame) and the Purdue Climate Change Research Center using an ensemble of 10 statistically downscaled global climate model simulations (Hamlet et al., 2018; Byun and Hamlet, 2018).
Both datasets were processed by Scott Robeson (Indiana University) to obtain the combination of high and low temperatures.
Data Scale
Extreme Heat data are calculated for each county in Indiana.
Calculation – Current Data
Current High Heat Days (HDC):
30-year average number of observed days with temperature highs 90°F and greater and temperature lows less than 68°F.
1⁄n ∑ i =1 nHDC,L,i : sum (Σ) of number of High Heat Days (HD) for period, C, location, L, during year, i, divided by the total numbers of years, n.
C = 1971-2000
L = Each Indiana county
i = 1971, 1972, 1973…2000
n = 30
Current High Heat Nights (HNC):
30-year average number of observed days with temperature highs less than 90°F and temperature lows 68°F or greater.
1⁄n ∑ i =1 nHNC,L,i : sum (Σ) of number of High Heat Nights (HN) for period, C, location, L, during year, i, divided by the total numbers of years, n.
C = 1971-2000
L = Each Indiana county
i = 1971, 1972, 1973…2000
n = 30
Current High Heat Days with High Heat Nights(HDHNC):
30-year average number of observed days with temperature highs 90°F or greater with temperature lows 68°F or greater.
1⁄n ∑ i =1 nHDC,L,i : sum (Σ) of number of High Heat Days with Hight Heat Nights (HDHN) for period, C, location, L, during year, i, divided by the total numbers of years, n.
C = 1971-2000
L = Each Indiana county
i = 1971, 1972, 1973…2000
n = 30
Temperatures:
All temperatures were calculated and are displayed in degrees Fahrenheit.
Tmax: daily high temperature
Tmin: daily low temperature
TmaxL,Y : daily high temperature for location, L, and year, Y
TminL,Y : daily low temperature for location, L, and year, Y
(See PDF for full equation)
Calculation – 2050s Data
Projected High Heat Days (HDP):
30-year average projected number of days with temperature highs 90°F or greater and temperature lows less than 68°F.
1⁄n ∑ i =1 nHDP,L,i : sum (Σ) of number of High Heat Days (HD) for period, P, location, L, during year, i, divided by the total numbers of years, n.
P = 2041-2070
L = Each Indiana county
i = 2041, 2042, 2043,…2070
n = 30
Projected High Heat Nights (HNP):
30-year average projected number of days with temperature highs less than 90°F and temperature lows 68°F or greater.
1⁄n ∑ i =1 nHNP,L,i : sum (Σ) of number of High Heat Nights (HN) for period, P, location, L, during year, i, divided by the total numbers of years, n.
P = 2041-2070
L = Each Indiana county
i = 2041, 2042, 2043,…2070
n = 30
Projected High Heat Days with High Heat Nights (HDHNP):
30-year average projected number of days with temperature highs 90°F or greater with temperature lows 68°F or greater.
1⁄n ∑ i =1 nHDHNP,L,i : sum (Σ) of number of High Heat Days with Hight Heat Nights (HDHN) for period, P, location, L, during year, i, divided by the total numbers of years, n.
P = 2041-2070
L = Each Indiana county
i = 2041, 2042, 2043,…2070
n = 30
Temperatures:
All temperatures were calculated and are displayed in degrees Fahrenheit.
Tmax: daily high temperature
Tmin: daily low temperature
TmaxL,Y : daily high temperature for location, L, and year, Y
TminL,Y : daily low temperature for location, L, and year, Y
(See PDF for full equation)
Extreme Precipitation
The average number of days per decade with an extreme precipitation event is calculated for each Indiana county for two time periods: current (1971-2000) and the 2050s (2041-2070) under two scenarios, resulting in three extreme precipitation event totals overall. The current data are based on observational weather data, and the 2050s projected data are based on climate projection data for “medium” and “high” greenhouse gas emission scenarios, also referred to as the Representative Concentration Pathways 4.5 and 8.5 scenarios (RCP4.5 and RCP8.5, respectively; Van Vuuren, et al., 2011).
RCP4.5 assumes that countries around the globe will simultaneously and effectively reduce greenhouse gas emissions (Thomson et al., 2011).
RCP8.5 assumes that countries around the globe do not try to achieve greenhouse gas reductions, resulting in a high level of greenhouse gas emissions (Riahi et al., 2011).
The Hoosier Resilience Index defines extreme precipitation events as days with precipitation of 2 inches or greater. Extreme precipitation events, especially rain, increase flooding risk, which can endanger lives, damage property, and wash fertilizer and sediment from agricultural fields (Widhalm et al., 2018). A 2 inch or greater storm leads to flooding in most Indiana communities. The Extreme Precipitation data only account for how many days per decade an extreme precipitation event occurs and do not explicitly address the intensity of those events. For example, a 2 inch storm on one day is counted as one event, and a 4 inch storm on another day is also counted as one event. The severity of extreme precipitation impacts is dependent on many other factors, such as soil moisture, topography, land cover, and groundwater hydrology (Hoegh-Guldberg et al., 2018).
The number of extreme precipitation events is given in terms of the number of days per decade with precipitation of 2 inches or greater.
Extreme Precipitation Days (PDExt):
Number of days, on average per decade, when daily precipitation (P) is 2 inches or greater.
P ≥ 2 inches
Three Extreme Precipitation values are calculated per county in Indiana.
Current Extreme Precipitation:
The 30-year (1971-2000, i.e. current period) average number of observed days per decade with precipitation of 2 inches or greater (i.e. Extreme Precipitation Days).
2050s Extreme Precipitation, Medium Emissions Scenario:
The 30-year (2041-2070, i.e. 2050s period) average projected number of days identified as an Extreme Precipitation Day, as calculated with the Representative Concentration Pathway 4.5.
2050s Extreme Precipitation, High Emissions Scenario:
The 30-year (2041-2070, i.e. 2050s period) average projected number of days identified as an Extreme Precipitation Day, as calculated with the Representative Concentration Pathway 8.5.
Data Sources
The input observation data used to generate the Current Extreme Precipitation data were provided by Alan Hamlet (University of Notre Dame) and the Purdue Climate Change Research Center, which coordinated the Indiana Climate Change Impacts Assessment (Hamlet et al., 2018; Byun and Hamlet, 2018).
The input projected data used to generate the projected Extreme Precipitation data were also provided by Alan Hamlet (University of Notre Dame) and the Purdue Climate Change Research Center using an ensemble of 10 statistically downscaled global climate model simulations (Hamlet et al., 2018; Byun and Hamlet, 2018).
Both datasets were processed by Scott Robeson (Indiana University) to obtain the number of 2 inch storms per decade, on average.
Data Scale
Extreme Precipitation data are calculated for each county in Indiana.
Calculation – Current Data
Current Extreme Precipitation Days (PDExt,C):
30-year average number of observed days, multipled by 10 to get a per-decade value, with daily precipitation at or above 2 inches.
10⁄n ∑ i =1 nPDExt,C,L,i : sum (Σ) of number of Extreme Precipitation Days (PDExt) for period, C, location, L, during year, i, divided by the total numbers of years, n, multipled by 10 to achieve a per decade value.
C = 1971-2000
L = Each Indiana county
i = 1971, 1972, 1973…2000
n = 30
(See PDF for full equation)
Calculation – 2050s Data
Projected Extreme Precipitation Days (PDExt,P):
30-year average projected number of days, multipled by 10 to get a per-decade value, with daily precipitation at or above 2 inches.
10⁄n ∑ i =1 nPDExt,P,L,i : sum (Σ) of number of Extreme Precipitation Days (PDExt) for period, P, location, L, during year, i, divided by the total numbers of years, n, multipled by 10 to achieve a per decade value.
C = 2041-2070
L = Each Indiana county
i = 2041, 2042, 2043,…2070
n = 30
(See PDF for full equation)
Floodplain Land Use
The Floodplain Land Use data are calculated for each Indiana county and incorporated city and town using 2010 observation-based land use data from the U.S. Environmental Protection Agency’s Integrated Climate and Land Use Scenarios (ICLUS) tool and the floodplain dataset from the “Best Available” Floodplain Mapping dataset of the Indiana Department of Natural Resources (IN DNR, 2018).
The Hoosier Resilience Index defines floodplain land as land within the 100-year and 500-year floodplains. The Floodplain Land Use component presents the amount and percent of floodplain acres per land use group and type. Although the USEPA dataset does model the projected land use change for 2050 based on population growth, migration, development, and climatic influences, only the 2010 observation-based land use data are used in the Hoosier Resilience Index.
Data Sources
| Dataset Title | Census Counties (2000) |
|---|---|
| Author | U.S. Census Bureau |
| Publication Date | 10/2002 |
| Data Date | 2000 |
| Scale/Resolution | Vector with 1:24,000 |
| Key Features | Shows counties and contains 2000 U.S. Census data regarding race, gender, age, families, and households. Data are from U.S. Census 2000 SF1 tables. |
| Layer Names | Census_County_TIGER00_IN.shp |
| Notes | Only the geographic boundaries were used from this shapefile. |
| Dataset Title | 2018 TIGER/Line® Shapefiles: Places, Indiana, Current Place State-based (Place > Indiana) |
|---|---|
| Author | U.S. Census Bureau |
| Publication Date | 05/2019 |
| Data Date | 2018 |
| Scale/Resolution | Vector with 1:500,000 |
| Key Features | Boundaries, roads, address information, water features, and more. |
| Layer Names | tl_2018_18_place.shp |
| Notes | Designed for use with GIS (geographic information systems). |
| Dataset Title | Best Available Flood Hazard |
|---|---|
| Author | Indiana Department of Natural Resources, Division of Water |
| Publication Date | 2018 |
| Data Date | 2018 |
| Scale/Resolution | Vector with maximum (zoomed in) 1:5,000 and minimum (zoomed out) 1:625,000 |
| Key Features | “Best available” floodplains within Indiana |
| Layer Names | [County_Name]_FloodHazard_BestAvai_DNR_Water.shp |
| Notes | 92 shapes files, one for each county. “The data layer "Best Available Flood Hazard Area" ("Best Available") is the Effective [Special Flood Hazard Area] with additional studies that have been reviewed and approved by the Division of Water. While this data has not yet been submitted to FEMA for inclusion in the FIRMs or NFHL (DFIRMs), this data can be used for general planning, construction, and development purposes.” From https://dnrmaps.dnr.in.gov/appsphp/fdms/. |
| Dataset Title | ICLUS v2.1.1 land use projections for SSP2 and RCP4.5 pathways |
|---|---|
| Author | U.S. Environmental Protection Agency, Office of Research and Development-National Center for Environmental Assessment |
| Publication Date | 07/27/2016 (Last Revised: 03/27/2017) |
| Data Date | 2000-2100 |
| Scale/Resolution | Contiguous U.S. with 90 m x 90 m pixels |
| Key Features | Primary land use for each location (i.e. pixel) |
| Layer Names | ICLUS_v2_1_1_land_use_conus_2010.tif, ICLUS_v2_1_1_land_use_conus_2050_ssp2_rcp45_giss_e2_r.tif |
| Notes | Only the ICLUS_v2_1_1_land_use_conus_2010.tif was used from dataset. Methodology documentation: Environmental Protection Agency (US EPA). (2017). Updates to the Demographic and Spatial Allocation Models to Produce Integrated Climate and Land-Use Scenarios (ICLUS) (Final Report, Version 2). DOI: EPA/600/R-16/366F. Available at: https://cfpub.epa.gov/ncea/iclus/recordisplay.cfm?deid=322479. |
Data Scale
Floodplain Land Use data are calculated for every county and incorporated city and town in Indiana.
Calculation
Select 100-year and 500-year Floodplains
Using ArcMap 10.6, the analysis outlined below was performed to retain only the 100-year and 500-year floodplains from the Indiana Department of Natural Resources (IDNR) “Best Available Flood Hazard” shapefiles. The analysis was performed on each of the 92 county files provided by the IDNR. These data were also used for the analysis of Indiana’s incorporated cities and towns.
ArcToolbox > Analysis Tools > Extract > Select
Input Features: [County name]_FloodHazard_BestAvai_DNR_Water.shp
Output Feature Class: Select_Floodplains_County_Pct.gdb/[County name]_Select_FloodHazard_BestAvai_DNR_Water.shp
Expression: "ZONE_SUBTY" <> 'AREA OF MINIMAL FLOOD HAZARD'
Notes: Select the floodplains that are not zoned as “area of minimal flood hazard.” Selection results in shapefile of A and AE floodplains (100-year) and X floodplains with “0.2 PCT ANNUAL CHANCE FLOOD HAZARD” (500-year).
Select Extent of 2010 ICLUS Land Use Raster
Using ArcMap 10.6, the below analysis was performed to retain a raster of land use for the state of Indiana.
ArcToolbox > Data Management Tools > Raster > Raster Processing > Clip
Input Raster: ICLUS_v2_1_1_land_use_conus_2010.tif
Output Extent: IN_State.shp (Census_County_TIGER00_IN.shp with dissolved boundaries leaving only the outline of Indiana)
Rectangle: Self populates from “Output Extent”
Use Input Features for Clipping Geometry: Checked
Output Raster Dataset: year_2010.tif
NoData Value: Self populates
Maintain Clipping Extent: Unchecked
Notes: Process one input raster file at a time. Creates raster file of Indiana.
Calculate Area and Percent of Land Use per County and Incorporated Area
Using ArcMap 10.6, the below analysis was performed to tabulate the type of land use within Indiana counties and incorporated areas.
ArcToolbox > Conversion Tools > From Raster > Raster to Polygon
Input rater: year_2010.tif
Field (optional): Value
Output polygon features: Polygon_ICLUS.gdb/year_2010.shp
Simplify polygons: Checked
Create multipart features: Unchecked
Maximum vertices per polygon feature: Blank
Notes: Creates polygon shapefile from land use raster file for use as Tabulate Intersection input.
ArcToolbox > Analysis Tools > Statistics > Tabulate Intersection
Input Zone Features: Census_County_TIGER00_IN.shp
Zone Fields: GEOID, NAME_L
Input Class Features: year_2010.shp
Output Table: Counties_2018_ICLUS_2010
Class Fields: Gridcode
Sum Fields: Blank
XY Tolerance: [leave field blank]
Output Units: SQUARE METERS
Notes: Creates table with the number of square meters per land use class/type per Indiana County.
ArcToolbox > Conversion Tools > Excel > Table to Excel
Input table: Counties_2018_ICLUS_2010
Output Excel File: Counties_2018_ICLUS_2010.xls
Notes: In Excel, the file was processed to calculate the acres and percent of county for each land use type/class and group.
ArcToolbox > Analysis Tools > Statistics > Tabulate Intersection
Input Zone Features: tl_2018_18_place.shp
Zone Fields: GEOID, NAME_L
Input Class Features: year_2010.shp
Output Table: Incorp_2018_ICLUS_2010
Class Fields: Gridcode
Sum Fields: Blank
XY Tolerance: [leave field blank]
Output Units: SQUARE METERS
Notes: Creates table with the number of square meters per land use class/type per Indiana incorporated area.
ArcToolbox > Conversion Tools > Excel > Table to Excel
Input table: Counties_2018_ICLUS_2010
Output Excel File: Counties_2018_ICLUS_2010.xls
Notes: In Excel, the file was processed to calculate the acres and percent of incorporated area for each land use type/class and group.
Calculate Area and Percent of Land Use with County’s 100-year and 500-year Floodplains
Using ArcMap 10.6, the below analysis was performed to tabulate the type of land use within Indiana counties’ 100-year and 500-year floodplains.
ArcToolbox > Analysis Tools > Statistics > Tabulate Intersection
Input Zone Features: [County name]_Select_FloodHazard_BestAvai_DNR_Water.shp
Zone Fields: GEOID, NAME_L
Input Class Features: year_2010.shp
Output Table: Counties_Floodplains_2018_ICLUS_2010
Class Fields: Gridcode
Sum Fields: Blank
XY Tolerance: [leave field blank]
Output Units: SQUARE METERS
Notes: Creates table with the number of square meters per land use class/type for the 100-year and 500-year floodplains within each Indiana county. Batch “Tabulate Intersection” was perform to analyze all 92 [County name]_Select_FloodHazard_BestAvai_DNR_Water.shp shapefiles.
ArcToolbox > Conversion Tools > Excel > Table to Excel
Input table: [County name]_Floodplains_2018_ICLUS_2010
Output Excel File: [County name]_Floodplains_2018_ICLUS_2010.xls
Notes: In Excel, the 92 Excel files were appended together and processed to calculate the acres and percent of county for each land use type/class and group within the county’s 100-year and 500-year floodplains.
Calculate Area and Percent of Land Use with Incorporated Area’s 100-year and 500-year Floodplains
Using ArcMap 10.6, the below analysis was performed to tabulate the type of land use within Indiana incorporated areas’ 100-year and 500-year floodplains.
ArcToolbox > Analysis Tools > Extract > Clip
Input Features: [County name]_Select_FloodHazard_BestAvai_DNR_Water.shp
Clip Features: tl_2018_18_place.shp
Output Feature Class: Select_Floodplains_Places_[County name].shp
XY Tolerance (optional): Blank
Notes: Batch “Clip” was perform to analyze all 92 [County name]_Select_FloodHazard_BestAvai_ DNR_Water.shp shapefiles.
ArcToolbox > Data Management Tools > General > Merge
Input Datasets: all 92 Select_Floodplains_Places_[County name].shp
Output Dataset: Select_Floodplains_Places_Merged_Counties.shp
Field Map (optional): Left as is
Notes: This creates a shapefile with an attribute table that contains all of the floodplains within Indiana incorporated areas.
ArcToolbox > Analysis Tools > Extract > Split
Input Features: Select_Floodplains_Places_Merged_Counties.shp
Split Features: tl_2018_18_place.shp
Split Field: GEOID
Target Workspace: Select_Floodplains_PlacesSplit_Merged_Counties.shp
XY Tolerance (optional): Blank
Notes: Creates a shapefile of floodplains such that floodplains that cross incorporated area boundaries are split into representative pieces according to the intersected incorporated area boundary. This allows for only the portion of floodplains within a specific incorporated area to be used during Tabulate Intersection.
ArcToolbox > Analysis Tools > Overlay > Spatial Join
Target Features: Select_Floodplains_PlacesSplit_Merged_Counties.shp
Join Features: tl_2018_18_place.shp
Output Feature Class: Select_Floodplains_NamedPlacesSplit_Merged_Counties.shp
Field Map of Join Features (optional): Keep all of the target features and join features
Match Option (optional): WITHIN
Search Radius (optional): Blank
Notes: Creates a shapefile with incorporated area attributes joins to the spatially relevant 100-year and 500-year floodplains.
ArcToolbox > Analysis Tools > Statistics > Tabulate Intersection
Input Zone Features: Select_Floodplains_NamedPlacesSplit_Merged_Counties.shp
Zone Fields: GEOID, NAME_L
Input Class Features: year_2010.shp
Output Table: Incorp_Floodplains_2018_ICLUS_2010
Class Fields: Gridcode
Sum Fields: Blank
XY Tolerance: [leave field blank]
Output Units: SQUARE METERS
Notes: Creates table with the number of square meters per land use class/type for the 100-year and 500-year floodplains within each Indiana county. Batch “Tabulate Intersection” was performed to analyze all 92 [County name]. Select_FloodHazard_BestAvai_DNR_Water.shp shapefiles.
ArcToolbox > Conversion Tools > Excel > Table to Excel
Input table: Incorp_Floodplains_2018_ICLUS_2010Count_2018_ICLUS_2010
Output Excel File: Incorp_Floodplains_2018_ICLUS_2010.xls
Notes: In Excel, the file was processed to calculate the acres and percent of incorporated area for each land use type/class and group within the incorporated area’s 100-year and 500-year floodplain.
Social Vulnerability
When climate change impacts occur, the most vulnerable populations within a community are hit first and hardest (Oxfam America, 2019). The inclusion of the Centers for Disease Control and Prevention’s Social Vulnerability Index (CDC, SVI) and its data in the Hoosier Resilience Index allows Indiana communities to overlay social vulnerability data with climate impacts to understand the resilience of their residents to hazardous events such as extreme heat and floods.
A social vulnerability score is calculated for each census tract in the state of Indiana using the CDC's Social Vulnerability Index methodology, as described in the CDC’s SVI 2018 Documentation (CDC, 2022), and the Census’ 2013-2017 American Community Survey data. While the CDC uses their SVI to rank census tracts across the United States, the Hoosier Resilience Index has scaled the SVI methodology to the state of Indiana. Social vulnerability rankings within the Hoosier Resilience Index compare each Indiana census tract to all of the other census tracts within the state.
The Hoosier Resilience Index defines social vulnerability using the same definition as the CDC. (See right panel)
What is the CDC's Social Vulnerability Index?
The Agency for Toxic Substances and Disease Registry’s (ATSDR) Geospatial Research, Analysis & Services Program (GRASP) created the CDC's Social Vulnerability Index to help public health officials and emergency response planners identify and map the communities that will most likely need support before, during, and after a hazardous event.
CDC’s SVI indicates the relative vulnerability of every U.S. Census tract. Census tracts are subdivisions of counties for which the Census collects statistical data. The SVI ranks the tracts on 15 social factors, including unemployment, minority status, and disability, and further groups them into four related themes. Thus each tract receives a ranking for each Census variable and for each of the four themes, as well as an overall ranking (CDC, 2019). See the SVI Introduction Video and the SVI Methods Video for more information.
What is social vulnerability?
Every community must prepare for and respond to hazardous events, whether a natural disaster like a tornado or a disease outbreak, or an anthropogenic event such as a harmful chemical spill. The degree to which a community exhibits certain social conditions, including high poverty, low percentage of vehicle access, or crowded households, may affect that community’s ability to prevent human suffering and financial loss in the event of disaster. These factors describe a community’s social vulnerability (CDC, 2019).
How can CDC’s SVI help communities be better prepared for hazardous events?
The SVI provides specific socially and spatially relevant information to help public health officials and local planners better prepare communities to respond to emergency events such as severe weather, floods, disease outbreaks, or chemical exposure (CDC, 2019).
The SVI can be used to:
- Allocate emergency preparedness funding by community need.
- Estimate the amount and type of needed supplies like food, water, medicine, and bedding.
- Decide how many emergency personnel are required to assist people.
- Identify areas in need of emergency shelters.
- Create a plan to evacuate people, accounting for those who have special needs, such as those without vehicles, the elderly, or people who do not understand English well.
- Identify communities that will need continued support to recover following an emergency or natural disaster. Estimate the amount of needed supplies like food, water, medicine, and bedding (CDC, 2019).
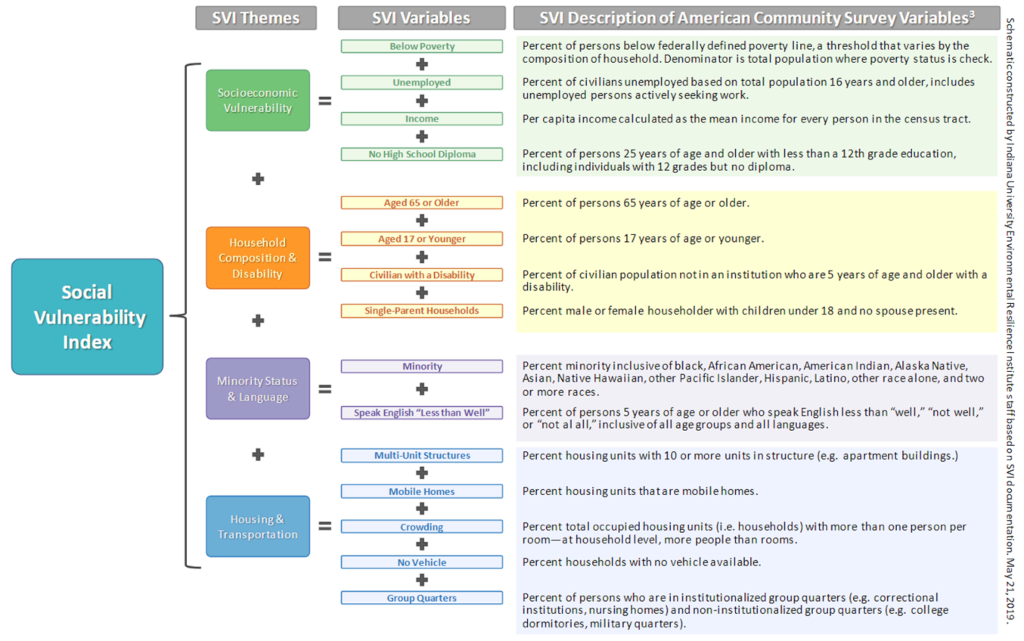
The CDC’s SVI organizes vulnerability into three tiers (see Figure 2):
- Tier I includes 15 census variables considered to be the indicators of social vulnerability.
- Tier II groups Tier I variables into four related themes.Socioeconomic Status (The Hoosier Resilience Index refers to this theme as "Socioeconomic vulnerability" to alleviate confusion with the data's interpretation)
- Household Composition & Disability
- Minority Status & Language
- Housing & Transportation
- Tier III provides an aggregation of the four themes, creating an “Overall Vulnerability” score.
The SVI methodology produces three ranking options for each census tract: by vulnerability variable, by vulnerability theme, and by overall vulnerability (Figure 2). Note:
- Rankings are calculated using a percentile ranking method.
- Percentile rank of 0 means least vulnerable; percentile rank of 1 means most vulnerable.
- For example, a census tract with a percentile rank of 0.8 is more vulnerable than 80% of census tracts across Indiana.
Data Sources
The input data were pulled from the U.S. Census 2013-2017 American Community Survey.
Data Scale
The Hoosier Resilience Index’s version of the CDC’s Social Vulnerability Index provides data and rankings for each census tract in Indiana, and calculates rankings for each Indiana census tract. Rankings are based on a comparison to the census tracts within Indiana.
Score Calculation
Data Collection
Socioeconomic Vulnerability (THEME1):
SVI theme comprising poverty, employment, income, and education variables.
Below Poverty (EP_POV):
Percent of persons, per census tract, below federally defined poverty line, a threshold that varies by the composition of household. Denominator is total population where poverty status is checked.
Unemployed (EP_UNEMP):
Percent of civilians, per census tract, unemployed based on total population 16 years and older, includes unemployed persons actively seeking work.
Income (EP_PCI):
Per capita income calculated as the mean income for every person in the census tract.
No High School Diploma (EP_NOHSDP):
Percent of persons, per census tract, 25 years of age and older with less than a 12th grade education, including individuals with 12 grades but no diploma.
Household Composition and Disability (THEME2):
SVI theme comprising age, disability, and single parenting variables.
Aged 65 or Older (EP_AGE65):
Percent of persons, per census tract, 65 years of age or older.
Aged 17 or Younger (EP_AGE17):
Percent of persons, per census tract, 17 years of age or younger.
Civilian with a Disability (EP_DISABL):
Percent of civilian population, per census tract, not in an institution who are 5 years of age and older with a disability.
Single-Parent Households (EP_SNGPNT):
Percent male- or female-led households, per census tract, with children under 18 and no spouse present.
Minority Status and Language (THEME3):
SVI theme comprising race, ethnicity, and English-language proficiency variables.
Minority (EP_MINRTY):
Percent minority, per census tract, inclusive of black, African American, American Indian, Alaska Native, Asian, Native Hawaiian, other Pacific Islander, Hispanic, Latino, other race alone, and two or more races.
Speak English “Less than Well” (EP_LIMENG):
Percent of persons 5 years of age or older, per census tract, who speak English “less than well,” “not well,” or “not at all,” inclusive of all age groups and all languages.
Housing and Transportation (THEME4):
SVI theme comprising house structure, crowding, and vehicle access variables.
Multi-Unit Structures (EP_MUNIT):
Percent housing units, per census tract, with 10 or more units in structure (e.g. apartment buildings.)
Mobile Homes (EP_MOBILE):
Percent housing units, per census tract, that are mobile homes.
Crowding (EP_CROWD):
Percent total occupied housing units (i.e. households), per census tract, with more than one person per room—at household level, more people than rooms.
No Vehicle (EP_NOVEH):
Percent households with no vehicle available.
Group Quarters (EP_GROUPQ):
Percent of persons, per census tract, who are in institutionalized group quarters (e.g. correctional institutions, nursing homes) and non-institutionalized group quarters (e.g. college dormitories, military quarters).
Overall Vulnerability (THEMES):
social vulnerability, at the census tract level, comprising of socioeconomic status, household composition and disability, minority status and language, and housing and transportation.
Ranking
Vulnerability Variables Percentile Ranks, Tier 1 (Flanagan et al., 2011; CDC, 2019):
Percentile rank was performed on all vulnerability variables in Excel using the function PERCENTRANK.INC with four significant digits:
Percentile ranks for each variable, except for Percentile Income, were calculated as:
Percentile XXXX (EPL_XXXX) = PERCENTRANK.INC( [array of census tracts for variable], [individual census tract], 4)
Percentile ranks for Percentile Income, were calculated as:
Percentile Income (EPL_PCI) = 1 - PERCENTRANK.INC( [array of census tracts for variable], [individual census tract], 4)
Socioeconomic Vulnerability Sum (SPL_THEME1):
Sum of variable percentiles for Socioeconomic Status theme.
SPL_THEME1 = EPL_POV + EPL_UNEMP + EPL_PCI + EPL_NOHSDP
Percentile Below Poverty (EPL_POV): Percentile percentage of persons below poverty estimate.
Percentile Unemployed (EPL_UNEMP): Percentile percentage of civilians (age 16+) unemployed estimate
Percentile Income (EPL_PCI): Percentile per capita income estimate.
No High School Diploma (EPL_NOHSDP): Percentile percentage of persons with no high school diploma (age 25+) estimate.
Household Composition and Disability Sum (SPL_THEME2):
Sum of variable percentiles for Household Composition and Disability theme.
SPL_THEME2 = EPL_AGE65 + EPL_AGE17 + EPL_DISABL + EPL_SNGPNT
Percentile Aged 65 or Older (EPL_AGE65): Percentile percentage of persons aged 65 and older estimate.
Percentile Aged 17 or Younger (EPL_AGE17): Percentile percentage of persons aged 17 years and younger estimate.
Percentile Civilian with a Disability (EPL_DISABL): Percentile percentage of civilian noninstitutionalized population with a disability.
Percentile Single-Parent Households (EPL_SNGPNT): Percentile percentage of single parent households with children under 18 estimate.
Minority Status and Language Sum (SPL_THEME3):
Sum of variable percentiles for Minority Status and Language theme.
SPL_THEME3 = EPL_MINTRY + EPL_LIMENG
Percentile Minority (EPL_MINRTY): Percentile percentage minority (all persons except white, non-Hispanic) estimate.
Percentile Speak English “Less than Well” (EPL_LIMENG): Percentile percentage of persons (age 5+) who speak English “less than well” estimate.
Housing and Transportation Sum (SPL_THEME4):
Sum of variable percentiles for Housing and Transportation theme.
SPL_THEME4 = EPL_MUNIT + EPL_MOBILE + EPL_CROWD + EPL_NOVEH +EPL_GROUPQ
Percentile Multi-Unit Structures (EPL_MUNIT): Percentile percentage housing in structures with 10 or more units estimate.
Percentile Mobile Homes (EPL_MOBILE): Percentile percentage mobile homes estimate.
Percentile Crowding (EPL_CROWD): Percentile percentage households with more people than rooms estimate.
Percentile No Vehicle (EPL_NOVEH): Percentile percentage households with no vehicle available estimate.
Percentile Group Quarters (EPL_GROUPQ): Percentile percentage of persons institutionalized) and non-institutionalized group quarters.
Themes Percentile Ranks; Tier 2 (Flanagan et al., 2011; CDC, 2019):
Percentile rank was performed on all theme sums in Excel using the function PERCENTRANK.INC with four significant digits. Percentile ranks for each theme sum were calculated as:
Percentile Ranking XXXX (RPL_THEMEX) = PERCENTRANK.INC( [array of census tracts for theme], [individual census tract], 4)
Percentile Ranking for Socioeconomic Vulnerability Theme (RPL_THEME1):
RPL_THEME1 = PERCENTRANK.INC( [array of census tracts for SPL_THEME1], [individual census tract], 4)
Percentile Ranking for Household Composition and Disability Theme (RPL_THEME2):
RPL_THEME2 = PERCENTRANK.INC( [array of census tracts for SPL_THEME2], [individual census tract], 4)
Percentile Ranking for Minority Status and Language Theme (RPL_THEME3):
RPL_THEME3 = PERCENTRANK.INC( [array of census tracts for SPL_THEME3], [individual census tract], 4)
Percentile Ranking for Housing and Transportation Theme (RPL_THEME4):
RPL_THEME4 = PERCENTRANK.INC( [array of census tracts for SPL_THEME4], [individual census tract], 4)
Overall Vulnerability Percentile Rank; Tier 3 (Flanagan et al., 2011; CDC, 2019):
Percentile rank was performed on the sum of all theme’s percentile ranking sums (e.g. RPL_THEMEX) in
Microsoft Excel using the function PERCENTRANK.INC with four significant digits.
Overall Sum of Themes (SPL_THEMES): Sum of theme percentile ranking.
SPL_THEMES = SPL_THEME1+ SPL_THEME2+ SPL_THEME3+ SPL_THEME4
Overall Percentile Ranking (RPL_THEMES):
RPL_THEMES = PERCENTRANK.INC( [array of census tracts for SPL_THEMES], [individual census tract], 4)
Flags
**Note - Flags are not presented in the Index’s online platform. Flagging data are, however, included in the downloadable dataset at https://services.arcgis.com/tKsJAIiLjd90D5q2/arcgis/rest/services/RPL_THEMES/FeatureServer.
Flags identify the census tracts where the variables, themes, and overall vulnerability percentiles are greater than 90, i.e. tracts that are more vulnerable than 90% of the census tracts in Indiana (Flanagan et al., 2011; CDC, 2019). Flagging was performed on each variable percentile rank (EPL_XXXX) in Excel. The flag count was then aggregated for each theme and then overall.
F_XXXX = EPL_XXXX >= 0.90; returns TRUE (1) or FALSE (0)
F_THEMEX = F_XXXX + F_XXXX + … + F_XXXX
F_TOTAL = F_THEME1 + F_THEME2 + F_THEME3 + F_THEME4
Sum of Flags for Socioeconomic Status Theme (F_THEME1):
F_THEME1 = F_POV + F_UNEMP + F_PCI + F_NOHSDP
Flag Below Poverty (F_POV):
Flag if the percentage of persons in poverty is in the 90th percentile.
Flag Unemployed (F _UNEMP):
Flag if the percentage of civilian unemployed is in the 90th percentile.
Flag Income (F _PCI):
Flag if the per capita income is in the 90th percentile.
90th percentile for per capita income includes the census tracts that fall within the bottom 10 percent of per capita income across the state. See page 30 for the definition.
Flag No High School Diploma (F _NOHSDP):
Flag if the percentage of persons with no high school diploma is in the 90th percentile.
Sum of Flags for Household Composition and Disability Theme (F_THEME2):
F_THEME2 = F_AGE65 + F_AGE17 + F_DISABL + F_SNGPNT
Flag Aged 65 or Older (F _AGE65):
Flag if the percentage of persons aged 65 and older is in the 90th percentile.
Flag Aged 17 or Younger (F _AGE17):
Flag if the percentage of persons aged 17 years or younger is in the 90th percentile.
Flag Civilian with a Disability (F _DISABL):
Flag if the percentage of persons with a disability is in the 90th percentile.
Flag Single-Parent Households (F _SNGPNT):
Flag if the percentage of single parent households is in the 90th percentile.
Sum of Flags for Minority Status and Language Theme (F_THEME3):
SVI theme comprising race, ethnicity, and English-language proficiency variables.
F_THEME3 = F_MINTRY + F_LIMENG
Flag Minority (F _MINRTY):
Flag if the percentage of minority is in the 90th percentile.
Flag Speak English “Less than Well” (F _LIMENG):
Flag if the percentage those with limited English is in the 90th percentile.
Sum of Flags for Housing and Transportation Theme (F_THEME4):
F_THEME4 = F_MUNIT + F_MOBILE + F_CROWD + F_NOVEH +F_GROUPQ
Flag Multi-Unit Structures (F _MUNIT):
Flag if the percentage households in multi-unit housing is in the 90th percentile.
Flag Mobile Homes (F _MOBILE):
Flag if the percentage of mobile homes in the 90th percentile.
Flag Crowding (F _CROWD):
Flag if the percentage of crowded households is in the 90th percentile.
Flag No Vehicle (F _NOVEH):
Flag if the percentage of households with no vehicles is in the 90th percentile.
Flag Group Quarters (F _GROUPQ):
Flag if the percentage of persons in group quarters is in the 90th percentile.
Sum of Flags for All Four Themes (F_TOTAL):
F_TOTAL = F_THEME1 + F_THEME2 + F_THEME3 + F_THEME4
Sum of flags for Socioeconomic Status theme (F_THEME1).
Sum of flags for Household Composition and Disability theme (F_THEME2).
Sum of flags for Minority Status and Language theme (F_THEME3).
Sum of flags for Housing and Transportation theme (F_THEME4).