User Manual:
The Hoosier Resilience Index provides data on four metrics. The first two address climate exposure: extreme heat and extreme precipitation provide information about current and projected future climate conditions. The second two establish vulnerability: floodplain land use determines the impact a community will experience from river flooding, and social vulnerability offers information on the location of lower-income and other marginalized or more generally vulnerable communities that may have limited capacity to cope with climate impacts when they occur. This combination of climate exposure and vulnerability provides a community with information to help them understand their climate risks.
The first step in preparing a community for climate change is understanding how these impacts will affect a community because they lead to a variety of secondary impacts, ranging from public health and safety to ecosystem and economic stability.
Homepage Maps and Charts
The Homepage Map - This map enables users to visually explore data on extreme heat, extreme precipitation, and developed land in the floodplain county by county.
Current and 2050s projection data on extreme heat and precipitation are displayed on the map, as is information on the amount of land that has been developed in the floodplain in each county. Toggle the radio dials to view a combination of extreme heat and extreme precipitation for the different time periods and emission scenarios (see data definitions below), or a combination of extreme precipitation and developed land in the floodplain.
Please Note
**The visualizations for extreme heat and developed land in the floodplain cannot be viewed at the same time.
**The radio dials for extreme heat and extreme precipitation only allow users to view the same time periods and emissions scenarios at once. For example, when you select “Current” under Extreme Heat Events, “Current” will also be selected under Extreme Precipitation Events. And when you select “2050s Medium Emissions Scenario” under Extreme Heat Events, “2050s Medium Emissions Scenario” will be automatically selected under Extreme Precipitation Events.
The Climate Exposure and Land Use in the Floodplain Charts - To view the values associated with extreme heat, extreme precipitation, and how land is used in the floodplain, select a county on the map and scroll down to the charts. The Climate Exposure chart displays extreme heat and extreme precipitation data for the current and 2050s time periods under two greenhouse gas emission scenarios. The second chart displays the amount of acres in the floodplain categorized by how the land is used (as of 2010; the Index does not attempt to predict future land use).
Please Note
**These data display the number of days of extreme heat and extreme precipitation events; the data do not convey how hot the days will get or how large the storms will be. Furthermore, it is possible that the number of projected precipitation events is lower than what a community is currently experiencing per decade, on average. In such a case, this would not indicate that a community will receive less total rain, because it is possible that a community will experience fewer extreme precipitation events, but with the precipitation amounts being larger.
**The projections for temperature and precipitation, on average across the state, are expected to continue to increase past the 2050s. Refer to the Indiana Climate Change Impacts Assessment to see 2080s projections.
What can I learn from this information?
The data displayed on the homepage map demonstrate that the entire state are expected to experience more extreme heat and precipitation events.
Toggle between the current and 2050s data projections to see that counties in the south and the southeast are expected to experience the greatest increase in the number of extreme heat events, as indicated by the dark red colors. All counties are expected to experience more days above 90°F and nights above 68°F than they are experiencing now. Note that counties in the central and northern parts of the state are likely to experience significant temperature increases, as well.
Toggle between the current and 2050s data projections to see a visual representation of the frequency of extreme precipitation events for each county. All counties are expected to experience more precipitation events at or above 2 inches. Counties in the southeast part of Indiana will likely see the greatest number of extreme precipitation events, as indicated by a county displaying more rain drops.
Turn on the land use layer, which cannot be viewed at the same time as the extreme heat layers, to see the distribution of developed land across the state. Dark green counties have a higher number of developed acres in the floodplain compared to the rest of the state. Not surprisingly, the areas with the largest amount of developed land in the floodplain are in the state’s largest cities. With the land use layer turned on, toggle between the precipitation layers to consider how land use could be impacted by increasing amounts of precipitation.
The charts contain the values associated with the information displayed on the map. To review the definitions of the data categories, hover over the information symbols (i) next to the radio dial options or refer to the data definitions section in this document.
Climate Vulnerability Page Maps and Charts
Each city, town, and county in Indiana will be impacted by climate change in a different way. Impacts depend on a community’s proximity to the floodplain, the characteristics of residents and infrastructure, and many other factors. The Climate Vulnerability page provides information and guidance to help communities in Indiana complete the four steps of a vulnerability assessment:
Climate Exposure – Identify the specific climate hazards that will impact your community
Community Sensitivity – Identify the people, resources, ecosystems, businesses, and services that will be impacted
Potential Impact – Evaluate the degree to which these people, resources, ecosystems, businesses, and services will be impacted
Adaptive Capacity – Evaluate the preparedness of these people, resources, ecosystems, businesses, and services
To view this information for a specific location in Indiana, type in a city, town, or county into the “Enter Location” box, and scroll down to the page to interact with the climate vulnerability data.
Climate Exposure
This section provides information on the two main climate impacts that the state of Indiana can expect – extreme heat and extreme precipitation. To review the definitions of the data displayed on the map, hover over the information markers “(i)” next to the chart title or refer to the data definitions section in this document.
Community Sensitivity
The Map - This section provides an interactive map through which users can evaluate land use in their communities and identify the people and infrastructure that will be impacted by more extreme heat days and nights as well as more extreme precipitation events. It can be helpful to review the definitions of each set of data displayed, before using this map.
- Turn on the land use layer(s) to see a visual display of categorized land use types. Toggle the 100-year and 500-year floodplain layers to see how the land in the floodplain is currently used. Alternatively, turn off the land use layer(s) and turn on the aerial photo to see a photographic image of a community combined with the floodplain lines to identify the properties, neighborhoods, buildings, forests, fields and other community amenities that are within or near the floodplain.
- Turn on the floodplain layers along with one social vulnerability layer at a time to see which census tracts intersect the floodplain.
- Toggle between the social vulnerability layers to identify the census tracts that may be most vulnerable to extreme heat.
The Land Use in the Floodplain and Social Vulnerability Charts - This section also provides two charts. The first displays the amount of acres in the floodplain categorized by how the land is used, and the second displays the percentile ranking for social vulnerability overall, and for each of the four social vulnerability categories. Because these data are only viewable at the census tract level, click on a census tract on the map while one of the social vulnerability map options is selected to view values in the Social Vulnerability chart.
The Social Vulnerability chart displays percentile rankings based on comparisons within Indiana. To download a report that contains a set of data that provide the number and percentage of people in a community that fall into various census categories, use Headwaters Economics’ Populations at Risk tool.
Consider these questions
As you toggle between the different map layers to visualize who and what could be impacted by extreme heat and extreme precipitation, consider these questions.
Extreme Heat Events
- Which census tracts contain residents who may be more susceptible to health impacts from high temperatures? Which census tracts contain residents who may be immunocompromised, such as the young, the elderly, and those already struggling with heath conditions?
- Households without air conditioning are often correlated with those that are low-income. Which census tracts are more likely to not have access to air conditioning? Do the residents in these areas have access to a community cooling center? Are they physically able to reach a cooling center if one exists?
Surface and River Flooding
- Which census tracts are most vulnerable to river flooding? Are the residents living within those census tracts able to evacuate if necessary? Will they understand news and instructions in English, or will they need an interpreter or translated materials? Will their homes be able to withstand a flood event? Do they have the resources they need to cope with the aftereffects of a flood?
- Where are all of the most vulnerable census tracts located in the community? Could they be impacted by surface flooding?
- What critical infrastructure (hospitals, schools, pumping stations, nursing homes, grocery stores, roads, bridges, etc.) are located in or near the floodplain?
- Where are the remaining critical facilities located? What is the chance that these locations could be impacted by surface flooding?
- What businesses could be impacted by river or surface flooding? Would that flooding impact employment, the provision of goods and services, or both?
- Although no information is provided through the Hoosier Resilience Index on dams and levees, consider what neighborhoods and critical structures may be impacted by a dam or levee break.
- What planned developments are located in or near the floodplain?
- What land is in or near the floodplain that would be okay to flood? What wetlands are located in or near the floodplain?
- What natural ecosystems are in or near the floodplain, and what within those ecosystems is at risk from a flood event?
Why should I care about developments that are near a floodplain, but not in a floodplain?
The Hoosier Resilience Index provides information on the number of 2’’ or greater precipitation events; it does not provide information on the size of these storms. The 100-year and 500-year floodplain lines are updated regularly by the Indiana Department of Natural Resources to account for the changing definitions of 100-year and 500-year rain events. These definitions change because, as more and more greenhouse gas emissions are trapped in the atmosphere, and the severity of climate change increases, the amount of rain calculated as having a one in 100 chance of happening increases.
Potential Impact
Now that you have identified the people and resources in your community that are at risk of being impacted by extreme heat and extreme precipitation, the Potential Impact section on the website provides a brief list of questions to help local governments assess the extent to which these people and resources could be impacted. To address the questions in this section, it can be helpful to assemble a team of internal and external experts based on the services provided in the community. The members of this team will depend on the specific impacts that are likely to occur within your jurisdiction; the government operations, infrastructure, and policies that will be addressed; the diversity of individuals that live in your community; and how the local government intends to interact with stakeholders and other entities in the region. One piece of guidance is to include at least one representative from every department likely to be affected by climate change. An example list of needed expertise could include community services, ecological systems, meteorology or climate science, planning and zoning, public health, stormwater management, transportation, wastewater treatment, and water supply.
Adaptive Capacity
The next step in the vulnerability assessment process is to assess the community’s readiness for anticipated impacts, and inventory the corresponding resources and barriers. The Hoosier Resilience Index’s Readiness Assessment is designed to assist with this analysis.
To complete the Readiness Assessment, click “Do the Readiness Assessment” and submit the form on the Readiness Assessment tab. Refer to the user manual's Readiness Assessment section for a detailed overview of the Assessment process.
Data Definitions
Extreme Heat and Extreme Precipitation
Extreme heat and extreme precipitation data are provided for two time periods: current and 2050s. The current data are based on observational weather data between 1971 and 2000, and the 2050s data are based on climate projection data for “medium” and “high” greenhouse gas emission scenarios. The medium and high emissions scenarios used in the Hoosier Resilience Index are the same as those used in the Indiana Climate Change Impacts Assessment; they are determined by scientists and climate modelers and follow standard practice in climate modeling.
Medium Emissions Scenario – Assumes that countries around the globe will simultaneously and effectively reduce greenhouse gas emissions.
High Emissions Scenario – assumes that countries around the globe do not try to achieve greenhouse gas reductions, resulting in a high level of greenhouse gas emissions.
The Hoosier Resilience Index defines extreme heat events as days with highs 90°F or greater and nights with lows 68°F or greater. Increasing daytime and nighttime temperatures are hazardous to human health, especially for sensitive populations (e.g. children, the elderly, low-income households, outdoor workers). The extreme heat data provided only account for the frequency of extreme temperatures, and do not explicitly include humidity. Nighttime low temperatures, however, provide a close approximation of the dewpoint temperature (and, therefore, humidity). Increased humidity exacerbates the health implications of extreme heat.
High Heat Days - Number of days, on average per year, where daily high temperature is 90°F or greater and daily low temperature is less than 68°F.
High Heat Nights - Number of days, on average per year, where daily high temperature is less than 90°F and daily low temperature is 68°F or greater.
High Heat Days with High Heat Nights - Number of days, on average per year, where the daily high temperature is 90°F or greater and daily low temperature is 68°F or greater.
The Hoosier Resilience Index defines an extreme precipitation event as a day with precipitation of 2 inches or greater. Extreme precipitation events, especially rain, increase flooding risk, which can endanger lives, damage property, and wash fertilizer and sediment from agricultural fields. The extreme precipitation data only account for how many days per decade an extreme precipitation event occurs and do not explicitly address the intensity of those events. For example, a 2 inch storm on one day is counted as one event, and a 4 inch storm on another day is also counted as one event. The severity of extreme precipitation impacts is dependent on many other factors, such as soil moisture, topography, land use, and groundwater hydrology.
Extreme Precipitation - Number of days, on average per decade, where daily precipitation is 2 inches or greater.
Floodplain Land Use
The floodplain land use data are calculated for each Indiana county and incorporated city and town using 2010 observation-based land use data from the U.S. Environmental Protection Agency’s Integrated Climate and Land Use Scenarios (ICLUS) tool and the floodplain dataset from the Indiana Best Available Floodplain Mapping dataset of the Indiana Department of Natural Resources.
The Hoosier Resilience Index defines floodplain land as land within the 100-year and 500-year floodplains.
100-year flood – A flood event that statistically has a 1% (1 in 100) chance of occurring in a given year.
500-year flood – A flood event that statistically has a 0.02% (1 in 500) chance of occurring in a given year.
The Floodplain Land Use component presents the amount and percent of floodplain acres per land use type. ICLUS groups the land use types into four categories, which are defined below.
Agricultural Land – Land primarily devoted to growing crops, and raising and harvesting animals.
Developed Land – Land primarily devoted to human activity, such as living and working.
Forest and Vegetation – Land used primarily to preserve nature, which is generally inaccessible to the public.
Wetland – Land with permanently or seasonally waterlogged soil, such that conditions are suitable for water-loving vegetation.
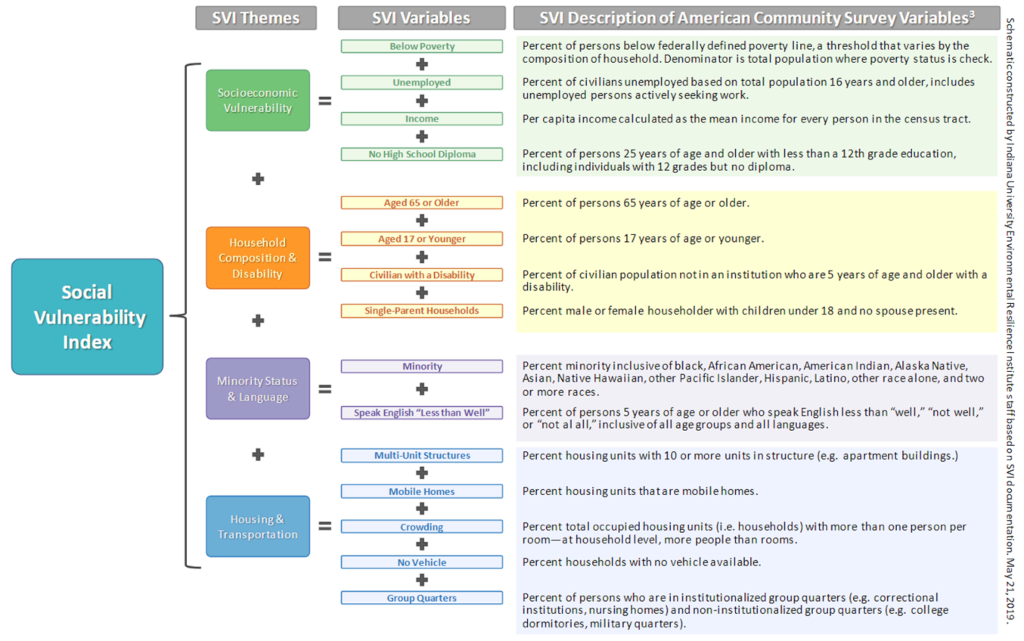
Social Vulnerability
The social vulnerability data presented in the Hoosier Resilience Index were calculated for Indiana using the same model that the Centers for Disease Control and Prevention uses to calculate the Social Vulnerability Index for the entire United States. See the list and definitions of each variable in the image, below.