Climate Vulnerability

Understand your community's climate vulnerabilities

Every city, town, and county in Indiana will be impacted by climate change in a different way. How a community experiences climate change depends on many factors, such as a community's proximity to floodplains, the strength of local infrastructure, and more. Social and racial inequities will cause some residents to experience climate change impacts sooner and more severely. The sections below provide information and guidance to help communities in Indiana assess their vulnerability.

Use the textboxes above to view this information for your community.

Climate Exposure

What does climate change mean for my community?

This section provides information on the two main climate impacts that the state of Indiana can expect – extreme heat and extreme precipitation. To review data definitions, hover over the question marks.

Extreme Heat

Average Number of Extreme Heat Events per Year

Timeframe High Heat Days

The average number of days per year that daily high temperature is 90°F or greater and daily low temperature is less than 68°F.

High Heat Nights

The average number of days per year that daily high temperature is less than 90°F and daily low temperature is 68°F or greater.

High Heat Days and Nights

The average number of days per year that the daily high temperature is 90°F or greater and daily low temperature is 68°F or greater.

Total Days with Extreme Heat Events*

The average number of days per year with highs 90°F or greater and nights with lows 68°F or greater.

Current

The calculated average between 1971 and 2000.

- - -
2050s - Medium Emissions Scenario

The projected average between 2041 and 2070, based on a scenario that assumes countries around the globe will simultaneously and effectively reduce greenhouse gas emissions.

- - - -
2050s - High Emissions Scenario

The projected average between 2041 and 2070, based on a scenario that assumes countries around the globe do not try to achieve greenhouse gas reductions.

- - - -
* This number may contain a rounding error.

Extreme Precipitation

Average Number of Extreme Precipitation Events per Decade

Timeframe Extreme Precipitation Events

The average number of days per decade when daily precipitation is two inches or greater.

Current

The calculated average between 1971 and 2000.

-
2050s - Medium Emissions Scenario

The projected average between 2041 and 2070, based on a scenario that assumes countries around the globe will simultaneously and effectively reduce greenhouse gas emissions.

-
2050s - High Emissions Scenario

The projected average between 2041 and 2070, based on a scenario that assumes countries around the globe do not try to achieve greenhouse gas reductions.

-

**Note that these data display the number of days of extreme heat and extreme precipitation events; the data do not convey how hot the days will get or how large the storms will be. Furthermore, it is possible that the number of projected precipitation events is lower than what a community is currently experiencing per decade, on average. In such a case, this would not indicate that a community will receive less total rain, because it is possible that a community will experience fewer extreme precipitation events, but with the precipitation amounts being larger.

**Also note that the projections for temperature and precipitation, on average across the state, are expected to continue to increase past the 2050s. Refer to the Indiana Climate Change Impacts Assessment to see 2080s projections.

Land Use in the Floodplain

Land Use Type Acres in the Floodplain

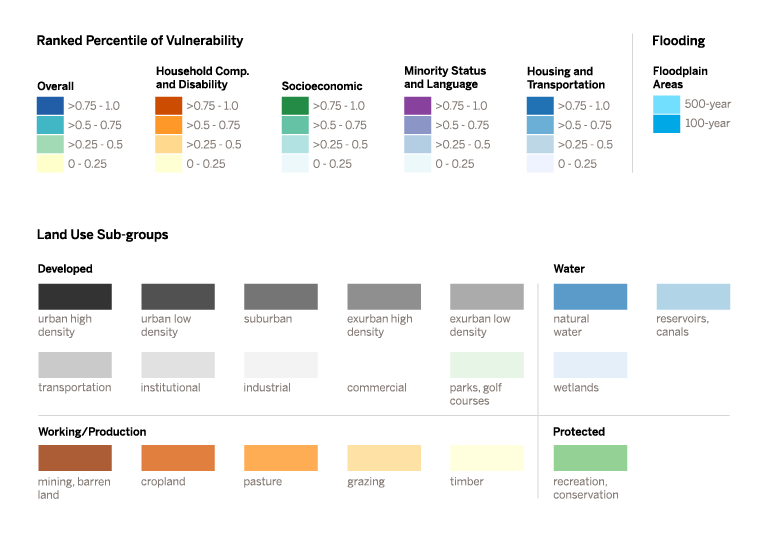
The number of acres in the 100-year and 500-year floodplains, as of 2020.
100-year flood: A flood event that statistically has a 1% (1 in 100) chance of occurring in a given year.
500-year flood: A flood event that statistically has a 0.02% (1 in 500) chance of occurring in a given year.

Percent of Total Acres in the Floodplain

The percent of acres in the 100-year and 500-year floodplains, as of 2020.
100-year flood: A flood event that statistically has a 1% (1 in 100) chance of occurring in a given year.
500-year flood: A flood event that statistically has a 0.02% (1 in 500) chance of occurring in a given year.

Agriculture

Land primarily devoted to growing crops, and raising and harvesting animals.

- - %
Developed

Land primarily devoted to human activity, such as living and working.

- - %
Forest and Vegetation

Land used primarily to preserve nature, which is generally inaccessible to the public.

- - %
Wetland

Land with permanently or seasonally waterlogged soil, such that conditions are suitable for water-loving vegetation.

- - %
Total Acres in the Floodplain - 100%
Land use data are from the EPA's 2020 ICLUS dataset and the floodplain data are updated annually using maps obtained from the Indiana Department of Natural Resources. Social vulnerability data are derived from the US Census American Community Survey, 2016-2020. See the HRI Methodologyfor more information.
Social Vulnerability

Social Vulnerability ThemePercentile Ranking
Household Composition and Disability

A ranking within Indiana by Census tract using the following U.S. Census American Community Survey variables: persons aged 65 or older, persons aged 17 or younger, civilian with a disability, and single-parent household.

-
Housing and Transportation

A ranking within Indiana by Census tract using the following U.S. Census American Community Survey variables: multi-unit structures, mobile homes, crowding, no vehicle, and group quarters.

-
Minority Status and Language

A ranking within Indiana by Census tract using the following U.S. Census American Community Survey variables: minority and speak English “less than well.”

-
Socioeconomic Vulnerability

A ranking within Indiana by Census tract using the following U.S. Census American Community Survey variables: below poverty, unemployed, income, and no high school diploma.

-
Overall Vulnerability -

To see values in the table above, select a census tract in the map above when one of the “People” checkboxes is selected.

The Social Vulnerability chart displays percentile rankings based on comparisons within Indiana. To download a report that contains a set of data that provide the number and percentage of people in a community that fall into various census categories, use Headwaters Economics’ Populations at Risk tool.

What can I learn from these maps and charts?

Consider these questions as you toggle between the different map layers to visualize who and what could be impacted by extreme heat and extreme precipitation.

Extreme Heat Events

  • Which census tracts contain residents who may be more susceptible to health impacts from high temperatures? Which census tracts contain residents who may be immunocompromised, such as the young, the elderly, and those already struggling with heath conditions?
  • Households without air conditioning are often correlated with those that are low-income. Which census tracts are more likely to not have access to air conditioning? Do the residents in these areas have access to a community cooling center? Are they physically able to reach a cooling center if one exists?

Surface and River Flooding

  • Which census tracts are most vulnerable to river flooding? Are the residents living within those census tracts able to evacuate if necessary? Will they understand news and instructions in English, or will they need an interpreter or translated materials? Will their homes be able to withstand a flood event? Do they have the resources they need to cope with the aftereffects of a flood?
  • Where are all of the most vulnerable census tracts located in the community? Could they be impacted by surface flooding?
  • What critical infrastructure (hospitals, schools, pumping stations, nursing homes, grocery stores, roads, bridges, etc.) are located in or near the floodplain?
  • Where are the remaining critical facilities located? What is the chance that these locations could be impacted by surface flooding?
  • What businesses could be impacted by river or surface flooding? Would that flooding impact employment, the provision of goods and services, or both?
  • Although no information is provided through the Hoosier Resilience Index on dams and levees, consider what neighborhoods and critical structures may be impacted by a dam or levee break.
  • What planned developments are located in or near the floodplain?
  • What land is in or near the floodplain that would be okay to flood? What wetlands are located in or near the floodplain?
  • What natural ecosystems are in or near the floodplain, and what within those ecosystems is at risk from a flood event?

Potential Impact

What is the level of disruption to normal community function?

Use the list of questions below to assess the extent to which residents and resources could be impacted. To address the questions in this section, it can be helpful to assemble a team of internal and external experts based on the services provided in the community. The members of this team will depend on the specific impacts that are likely to occur within your jurisdiction; the government operations, infrastructure, and policies that will be addressed; the diversity of individuals that live in your community; and how the local government intends to interact with stakeholders and other entities in the region. One piece of guidance is to include at least one representative from every department likely to be affected by climate change (Climate Impacts Group et al., 2007). An example list of needed expertise could include community services, ecological systems, meteorology or climate science, planning and zoning, public health, stormwater management, transportation, wastewater treatment, and water supply.

The questions below offer some topics for conversation, but do not address absolutely all possible impacts a community could experience based on the characteristics of its residents, location, and structure of its community. These questions were developed based on best practices listed in Climate Impacts Group et al., Preparing for Climate Change: A Guidebook for Local, Regional, and State Governments; Boswell et al., Climate Action Planning; and from the expertise at the Environmental Resilience Institute.

  • What neighborhoods are located in the census tracts that contain a high proportion of immunocompromised residents and/or a high proportion of homes without air conditioning? Which of those neighborhoods do not have adequate resources to support residents’ needs during extreme heat events?
  • Which populations are disproportionately vulnerable to flooding impacts? Think about the proximity of these residents to the floodplain, their ability to evacuate, and their ability to make changes to protect their homes. What other needs do these residents have that would exacerbate the devastation?
  • What are the maximum temperature specifications for the materials used to build roads and bridges in your community? Which roads and bridges are most likely to be impacted by the stress of higher temperatures and more freeze-thaw events? What would happen as a result of this stress?
  • Consider the structural integrity of critical infrastructure, such as energy plants, hospitals, and schools, among others. How much flooding could they withstand? Were “impact thresholds” identified when this infrastructure was designed? How would those impact thresholds hold up to anticipated temperature and precipitation increases?
  • What size rain event is the majority of your stormwater drainage able to accommodate? Will that be sufficient for the size of anticipated rain events?
  • What policies exist to help protect undeveloped land in the floodplain and land that is near the floodplain? What policies exist that help protect land that helps manage flood water?
  • Is the electric grid prepared for changes in supply and demand?
  • Is the water delivery system ready for changes in supply and demand?
  • Think about the systems and services members of your community rely on regularly. Are there systems that are already stressed that might have a hard time responding under extreme circumstances?
  • Are there plants and animal species that are threatened or endangered within your jurisdiction?
  • Are there other impacts that haven’t been considered?

Adaptive Capacity

Are we ready?

The next step in the vulnerability assessment process is to assess your community’s readiness for anticipated impacts, and inventory the corresponding resources and barriers. The Hoosier Resilience Index’s Readiness Assessment is designed to assist with this analysis.